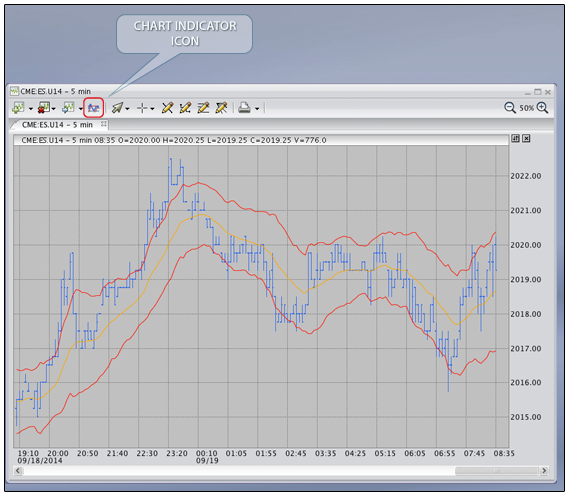
The "Charting" package allows unlimited Indicators to be placed on the chart itself.
Firetip charts do not lock you into any proprietary settings. While
we have provided the most popular inputs as defaults, you are free
to enter any value you wish. To access the list of available indicators,
click on the "Chart" window's toolbar, as shown in the following
illustration.

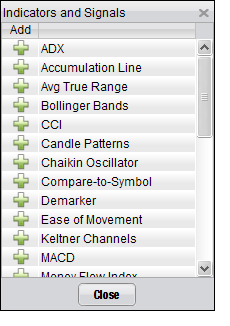
The "Indicators and Signals" list window is displayed, as
shown in the illustration below. Simply click the ![]()

The "Add Indicator" dialog, illustrated below, is displayed so that you can configure the look of the Indicator as it will be shown on the Chart.
The following Indicators are included.
Moving Average Convergence - Divergence (MACD)
Please refer to the documentation for each Indicator or Signal for details.