The Money Flow Index (MFI) charting Indicator is a momentum indicator that uses a stock’s price and volume to predict the reliability of the current trend. Because the Money Flow Index adds trading volume to the Relative Strength Index (RSI), it’s sometimes referred to as volume-weighted RSI.
Arriving at the index figure requires several steps. The developers of the Money Flow Index, Gene Quong and Avrum Soudack, suggested using a 14-day period for calculations.
1. Determine the Typical Price as follows: (High + Low + Close) / 3
2. Calculate the Raw Money Flow: Typical Price x Volume
3. Identify the Money Flow Ratio: (14-period Positive Money Flow) / (14-period Negative Money Flow)
(Note: Positive money values are created when the typical price is greater than the previous typical price value. The sum of positive money over the number of periods – usually 14 days – is the positive money flow. The opposite is true for the negative money flow values.)
4. Finally, arrive at the Money Flow Index. This is: 100 – [100/(1 + Money Flow Ratio)]
Many traders watch for opportunities that arise when the MFI moves in the opposite direction as the price. This divergence can often be a leading indicator of a change in the current trend.
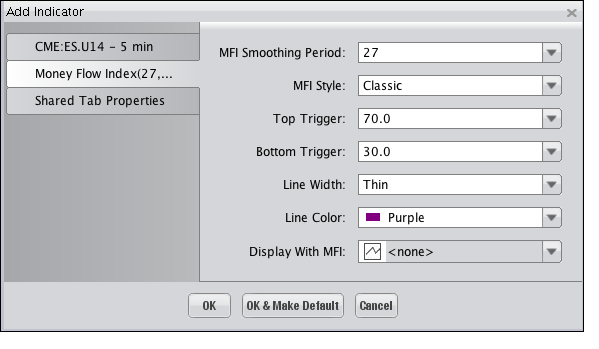
Selecting the Money Row Index Indicator on the "Indicators and Symbols" list displays the "Add Indicator" dialog, illustrated below, where you an choose among the different options available to have the Indicator display on the Chart as you'd like it to. Click "OK" to add the Indicator.

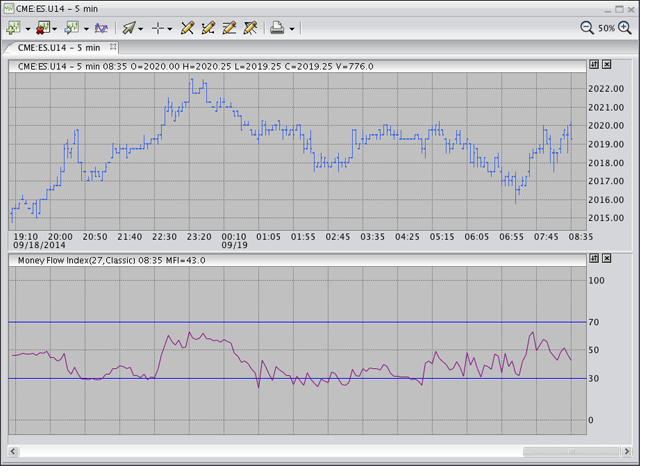
The Indicator is displayed within its own window, as shown in the following illustration.
