The Demarker charting Indicator is an Indicator used in technical analysis that compares the most recent price action to the previous period's price in an attempt to measure the demand of the underlying asset. This Indicator is generally used to identify price exhaustion and can also be used to identify market tops and bottoms. This oscillator is bounded between -100 and +100 and, unlike many other oscillators, it does not use smoothed data.
Technical traders primarily use this Indicator as a method of identifying the riskiness of the levels in which they wish to place a transaction. Generally, values above 60 are indicative of lower volatility and risk, while a reading below 40 is a sign that risk is increasing.
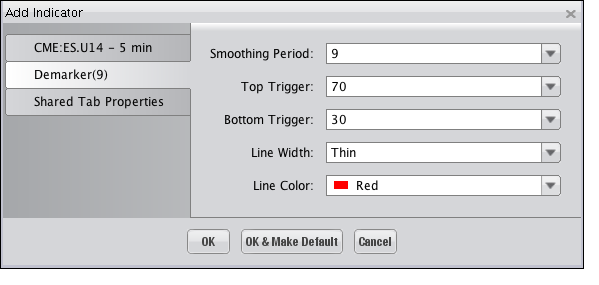
Selecting the Demarker Indicator on the "Indicators and Symbols" list displays the "Add Indicator" dialog, illustrated below, where you an choose among the different options available to have the Indicator display on the Chart as you'd like it to. Click "OK" to add the Indicator.

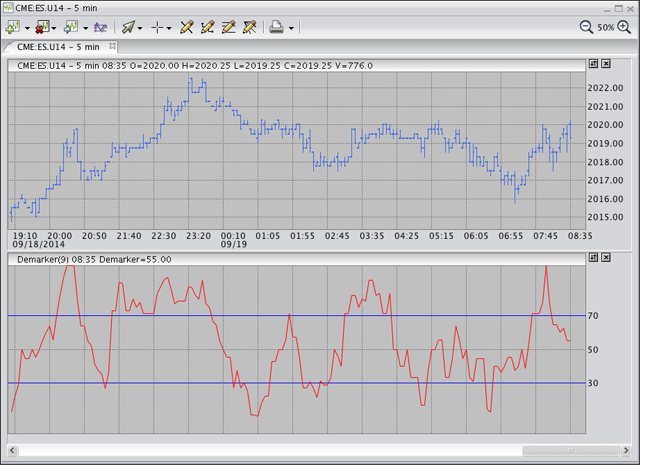
The Indicator is displayed within its own window, as shown in the following illustration.
