The Average Directional Index (ADX) Charting Indicator is used in technical analysis as an objective value for the strength of trend. ADX is non-directional so it will quantify a trend's strength regardless of whether it is up or down. ADX is usually plotted in a "Chart" window along with two lines known as the DMI (Directional Movement Indicators). ADX is derived from the relationship of the DMI lines. Analysis of ADX is a method of evaluating trend and can help traders to choose the strongest trends and also how to let profits run when the trend is strong.
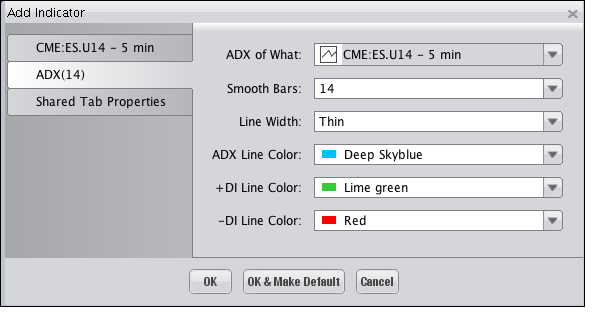
Selecting the ADX Chartinng Indicator on the Indicators and Symbols list displays the "Add Indicator" dialog, illustrated below, where you an choose among the different options available to have the Indicator display on the Chart as you'd like it to. Click "OK" to add the Indicator.

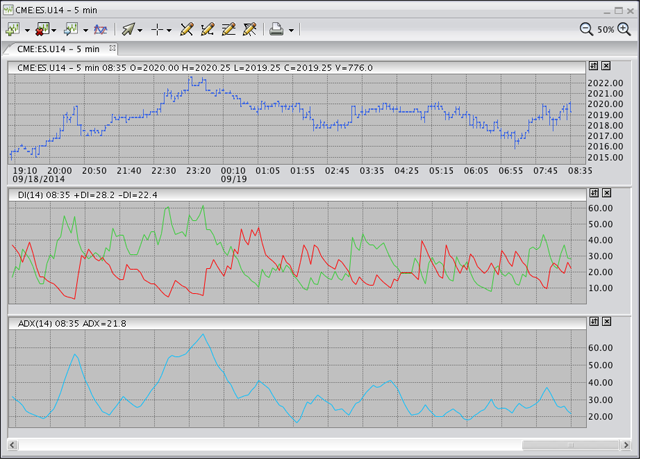
As shown in the following illustration, the Indicator is displayed in windows beneath the Chart.
