WILLIAMS %R: Williams %R is a simple but effective oscillator developed by Larry Williams. It measures the capacity of bulls and bears to close prices each day near the edge of the recent price range. Williams %R confirms trends and warns of their upcoming reversals. Williams %R is designed to fluctuate between 0 and 100 percent. It equals 0 when bulls reach the peak of their power and close prices at the top of the range. It reaches 100 percent when bears are at the peak of their power and close prices at the bottom of the recent range. There are three types of trading signals to be used with Williams %R:
(1) Williams %R-Divergences: When Williams %R rises above its upper reference line, falls, and then cannot rise above that line during the next rally, it creates a bearish divergence (time to sell). It shows that the bulls are losing their power and the market is likely to fall. A bullish divergences occurs when Williams %R falls below its lower reference line, rallies, and then cannot decline below that line when prices slide again. It shows that bears are losing power and a rally is in the offing (time to buy).
(2) Williams %R-Failure Swings: Williams %R seldom reverses in the middle of its range. Failure swings occur when the Williams %R fails to rise above its upper reference line during a rally or fall below its lower reference line during a decline. When Williams %R stops rising in the middle of a rally and turns down without reaching its upper reference line, it produces a failure swing. This shows that bulls are especially weak and gives a sell signal. When Williams %R stops falling in the middle of a decline and turns up without reaching its lower reference line, that is a failure swing. It shows that bears are very weak and gives a buy signal.
(3) Williams %R: Overbought & Oversold: When prices close near the upper edge of their range, Williams %R reaches its top and becomes overbought. When prices close near the bottom of their recent range, Williams %R falls and becomes oversold. Without a major trend in place, prices seldom can continue to close at their extreme price range for many bars in a row. Therefore, when Williams %R rises above its upper reference line, it marks a potential market top and gives a sell signal. When Williams %R falls below its lower reference line, it markets a potential market bottom and gives a buy signal. When utilizing the overbought/oversold oscillator readings, it is important to identify the market as being in a trading range. Or better yet, if you identify the market as being in a bull market, it would be prudent to consider buying a temporary oversold condition. Vice versa, if the market has been in a longer term downtrend, selling a short-term overbought condition should be considered.
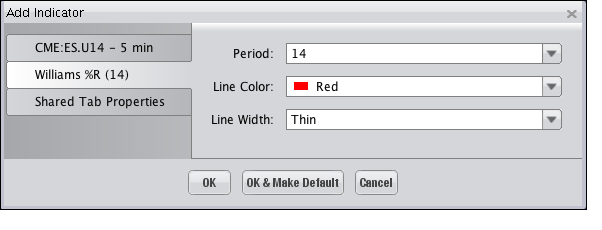
Selecting the Williams %R Indicator on the "Indicators and Symbols" list displays the "Add Indicator" dialog, illustrated below, where you an choose among the different options available to have the Indicator display on the Chart as you'd like it to. Click "OK" to add the Indicator.

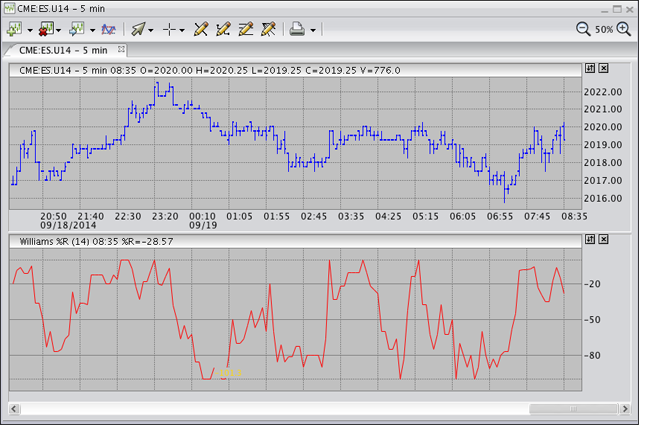
The Indicator is displayed within its own window, as shown in the following illustration.
