Stochastics
STOCHASTICS:
Stochastic is an oscillator popularized by George Lane. Stochastic
consists of two lines: a fast line called %K and a slow line called %D. Slow
Stochastics and Fast Stochastics incorporate both %K and %D. The
Fast Stochastic is very sensitive to market turns but leads to many whipsaws. Some
traders therefore prefer the Slow Stochastic which is a little less sensitive
in its identification of market turns, but results in less market noise
and whipsaws. Stochastic is designed to fluctuate between 0
and 100. Popular references line are drawn at 20 and 80 with
the center line at 50. Stochastic shows when bulls or bears
become stronger or weaker. This information helps you decide
whether bulls or bears are likely to win the current "fight"
in the market.
There are generally three types of Stochastic trading signals:
- Stochastic-Divergences: A
bullish divergence occurs when prices for a particular market fall
to a new low, but Stochastic traces a higher bottom than during the
previous decline. When a bullish divergence occurs, this
is sign that the sellers are losing the upper hand and it may be time
to buy. Vice versa, a bearish divergence occurs when prices
rally to a new swing high, but Stochastic traces a lower top than
during its previous rally. This is a sign that the buyers
may be thinning out and it is time to sell.
- Stochastic-Overbought &
Stochastic Oversold: When Stochastic rallies above
its upper reference line (80), it shows that the market is overbought. Overbought
means too high, ready to turn down. When Stochastic falls
below its lower reference line, it shows that the market is oversold. Oversold
means too low, ready to turn up. It is very important to
note that the Overbought & Oversold conditions for Stochastics
only work well when you have a firm feeling that the market is in
a trading range. If the market is in a trend or establishing
a new trend, the Stochastic can be overbought or oversold for a significant
period of time. You do not want to trade against the trend
in these situations.\n\nStochastic: Line Direction\nWhen both Stochastic
lines (%K and %D) are headed in the same direction, they confirm the
short-term trend. When prices rise and both Stochastic
lines rise, the uptrend is likely to continue. When prices
slide and both Stochastic lines fall, the short-term downtrend is
likely to continue.
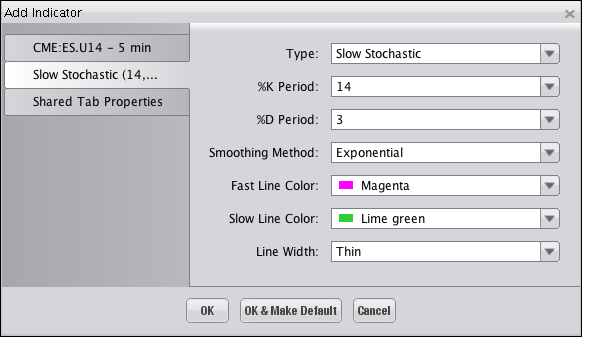
Selecting the Stochastics Indicator on the "Indicators and
Symbols" list displays the "Add Indicator" dialog, illustrated
below, where you an choose among the different options available to have
the Indicator display on the Chart as you'd like it to. Click "OK"
to add the Indicator.

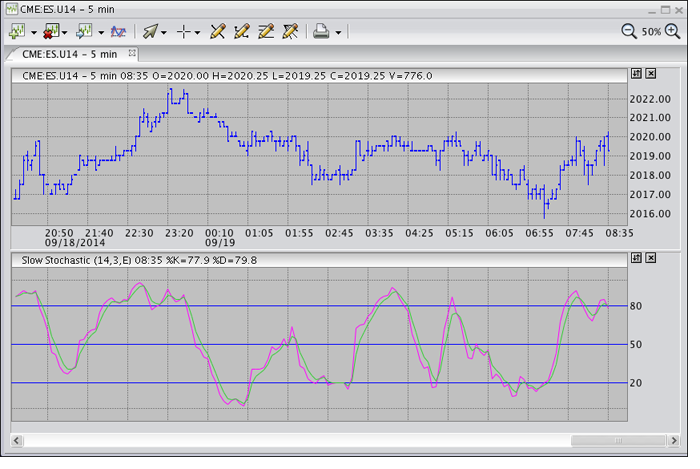
The Indicator is displayed within its own window, as shown in the following
illustration.


