The formula used in the calculation of Woodie Pivot Points are:
R4 = R3 + RANGE
R3 = H + 2 * (PP - L) (same as: R1 + RANGE)
R2 = PP + RANGE
R1 = (2 * PP) - LOW
PP = (HIGH + LOW + (TODAY'S OPEN * 2)) / 4
S1 = (2 * PP) - HIGH
S2 = PP - RANGE
S3 = L - 2 * (H - PP) (same as: S1 - RANGE)
S4 = S3 - RANGE
Where R1 through R4 are Resistance levels 1 to 4, PP is the Pivot Point,
S1 through S4 are support levels 1 to 4, RANGE is the High minus the Low
for the given time frame (usually daily).
One of the key differences in calculating Woodie's Pivot Point to other
pivot points is that the current session's open price is used in the PP
formula with the previous session's high and low. At the time-of-day that
you calculate pivot points you might not have the opening price so you
could use the Classic formula for the Pivot Point and vary the R3 and
R4 formula as per Woodie's formulas.
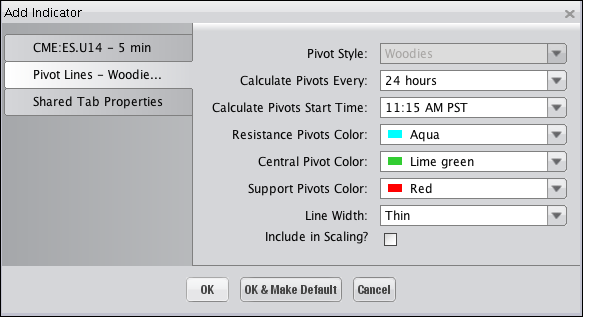
Selecting the Pivot Lines - Woodies Indicator on the "Indicators and Symbols" list displays the "Add Indicator" dialog, illustrated below, where you an choose among the different options available to have the Indicator display on the Chart as you'd like it to. Click "OK" to add the Indicator.

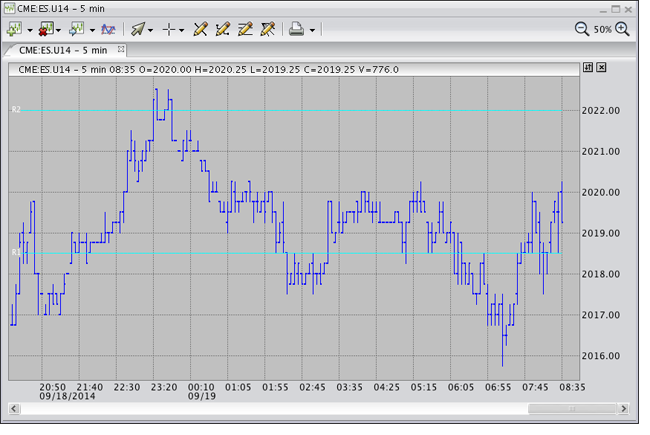
The Indicator is superimposed on the Chart, as shown in the following illustration.
