MOVING AVERAGE CONVERGENCE - DIVERGENCE (MACD): MACD is an advanced indicator constructed by Gerald Appel. The MACD has three inputs: Short, Long, and Signal. The "Fast Line" of the MACD is calculated by taking the difference between the short Exponential Moving Average (EMA) and the long EMA. The "slow" or "signal" line is calculated by taking the Signal EMA of the "fast" line. A histogram is included which calculated the difference between the two lines (the fast and signal line). MACD Trading Strategy: When the fast MACD line crosses the slow Signal line, it gives a buy signal. Go long, and place a protective stop below the latest minor low. When the fast line crosses below the slow line, it gives a sell signal. Go short, and consider placing a protective stop above the latest minor high. MACD Histogram: Buy when the MACD-Histogram stops falling and ticks up. Place a protective stop below the latest minor low. Sell short when MACD-Histogram stops rising and ticks down. Place protective stop above the latest minor high. Second Histogram Strategy: When prices rally to a new high, but MACD-Histogram traces a lower top, it creates a bearish divergence (time to sell). When prices are making new lows, but the MACD-Histogram traces a more shallow low, it creates a bullish divergence (time to buy).
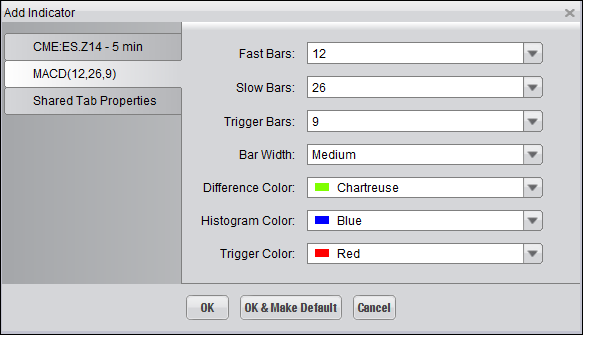
Selecting the MACD Indicator on the "Indicators and Symbols" list displays the "Add Indicator" dialog, illustrated below, where you an choose among the different options available to have the Indicator display on the Chart as you'd like it to. Click "OK" to add the Indicator.

The Indicator is displayed within its own window, as shown in the following illustration.
