The On Balance Volume (OBV) charting Indicator is a momentum indicator that uses volume flow to predict changes in stock price. On Balance Volume is a metric developed by Joseph Granville in the 1960s. He believed that when volume increases sharply without a significant change in the stock’s price, the price will eventually jump upward, and vice versa.
The theory behind OBV is based on the distinction between smart money – namely, institutional investors – and less sophisticated retail investors. As mutual funds and pension funds begin to buy into an issue that retail investors are selling, volume may increase even as the price remains relatively level. Eventually, volume drives the price upward. At that point, larger investors begin to sell, and smaller investors begin buying.
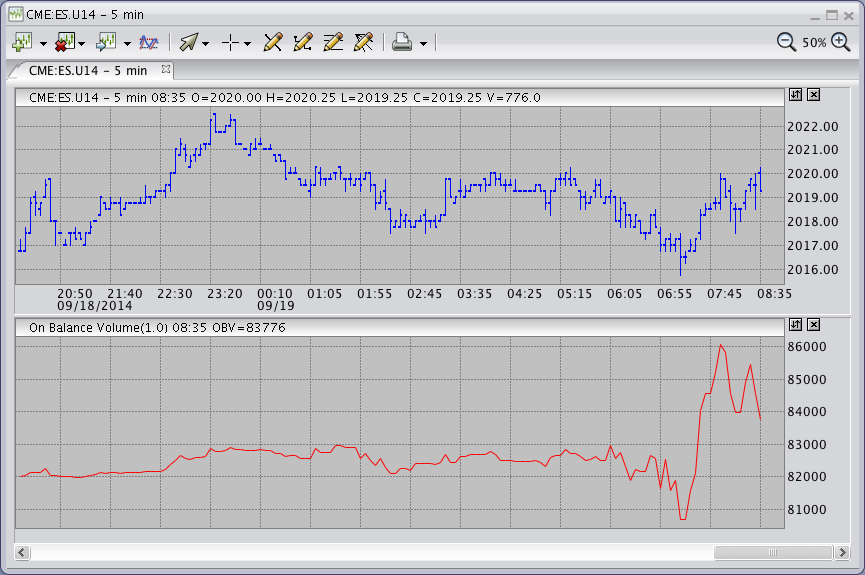
The following chart depicts OBV. If today’s close is greater than yesterday’s close, then today's volume is added to yesterday’s OBV, and is considered “up volume.” However, if today’s close is less than yesterday’s close, today’s volume is subtracted from yesterday’s OBV and is considered “down volume.”
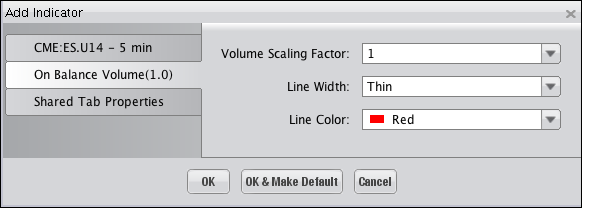
Selecting the On Balance Volume Indicator on the "Indicators and Symbols" list displays the "Add Indicator" dialog, illustrated below, where you an choose among the different options available to have the Indicator display on the Chart as you'd like it to. Click "OK" to add the Indicator.

The Indicator is displayed within its own window, as shown in the following illustration.
