Volume by Price is an indicator that shows the amount of volume for a particular price range. Volume by Price bars are shown horizontally on the left-hand side of the chart to match up with price points. These color-coded bars divide volume based on up periods (green) and volume on down periods (red). Chartists can use Volume by Price to identify high volume price points that may provide support or resistance.
Volume by Price calculations are based on the entire period displayed on the Chart. A five-month daily chart would be based on ALL five months of daily price data. A two-week, 30-minute chart would be based on two weeks of 30-minute price data. A three year weekly chart would be based on three years of weekly data. Volume by Price calculations do not extend beyond the historical data shown on the chart.
There are four steps involved in the calculation. All calculations are based on closing prices.
1. Find the closing high-low range for the entire period.
2. Divide this range by 12 to create 12 equal price blocks.
3. Total the amount of volume traded within each price block.
4. Divide the volume into up volume and down volume.
Volume is negative when the closing price moves down from one period to the next. Volume is positive when the closing price moves up from one period to the next.
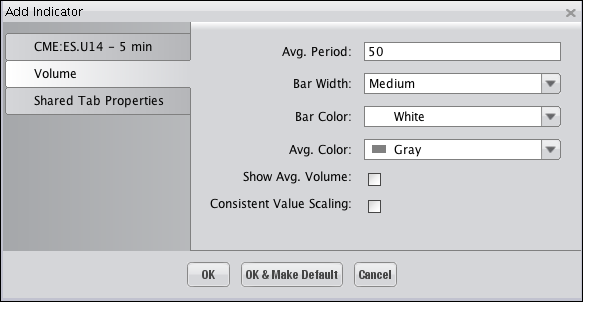
Selecting the Volume Indicator on the "Indicators and Symbols" list displays the "Add Indicator" dialog, illustrated below, where you an choose among the different options available to have the Indicator display on the Chart as you'd like it to. Click "OK" to add the Indicator.

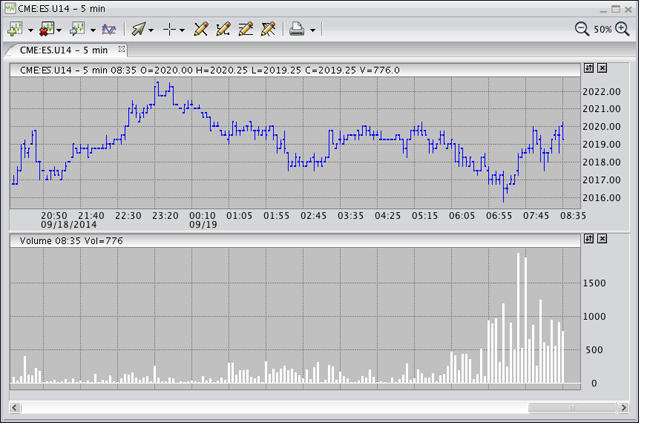
The Indicator is displayed within its own window, as shown in the following illustration.
