The Accumulation Line Charting Indicator is a momentum Indicator that attempts to gauge supply and demand by determining whether investors are generally "accumulating" (buying) or "distributing" (selling) a certain stock by identifying divergences between stock price and volume flow. It is calculated using the following formula:
Acc/Dist = ((Close – Low) – (High – Close)) / (High – Low) * Period's volume
For example, many up days occurring with high volume in a downtrend could signal that the demand for the underlying is starting to increase. In practice, this indicator is used to find situations in which the indicator is heading in the opposite direction as the price. Once this divergence has been identified, the trader will wait to confirm the reversal and make his or her transaction decisions using other technical indicators.
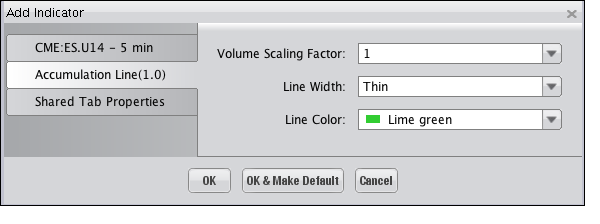
Selecting the Accumulation Line Indicator on the "Indicators and Symbols" list displays the "Add Indicator" dialog, illustrated below, where you an choose among the different options available to have the Indicator display on the Chart as you'd like it to. Click "OK" to add the Indicator.

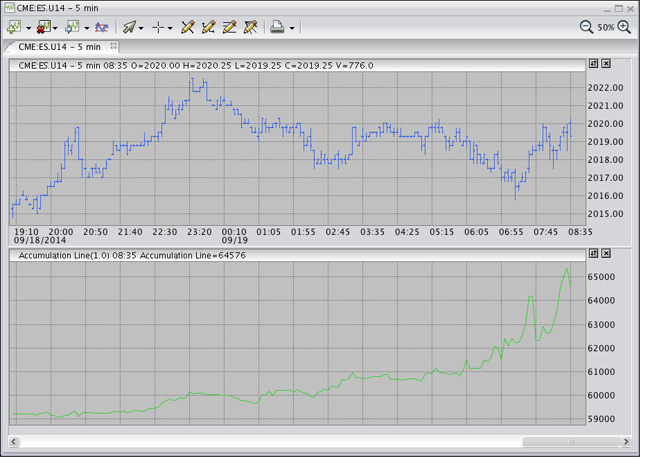
As shown in the following illustration, the Indicator is displayed beneath the Chart, within its own separate windows.
