Smoothing is the use of an algorithm to remove noise from a data set, allowing important patterns to stand out. Data smoothing can be done in a variety of different ways, including random, random walk, moving average, simple exponential, linear exponential and seasonal exponential smoothing. Data smoothing can be used to help predict trends, such as trends in securities prices.
The random walk model is commonly used to describe the behavior of financial instruments such as stocks. Some investors believe that there is no relationship between past movement in a security's price and its future movement. Random walk smoothing assumes that future data points will equal the last available data point plus a random variable. Technical and fundamental analysts disagree with this idea; they believe future movements can be extrapolated by examining past trends.
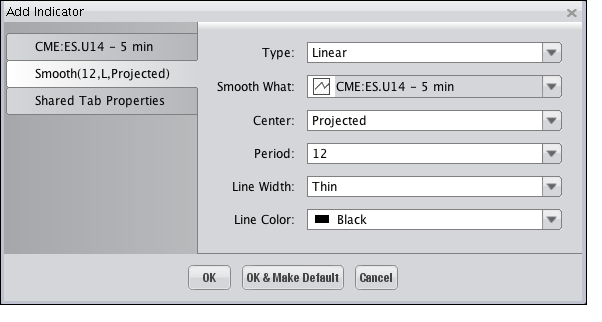
Selecting the Smooth Indicator on the "Indicators and Symbols" list displays the "Add Indicator" dialog, illustrated below, where you an choose among the different options available to have the Indicator display on the Chart as you'd like it to. Click "OK" to add the Indicator.

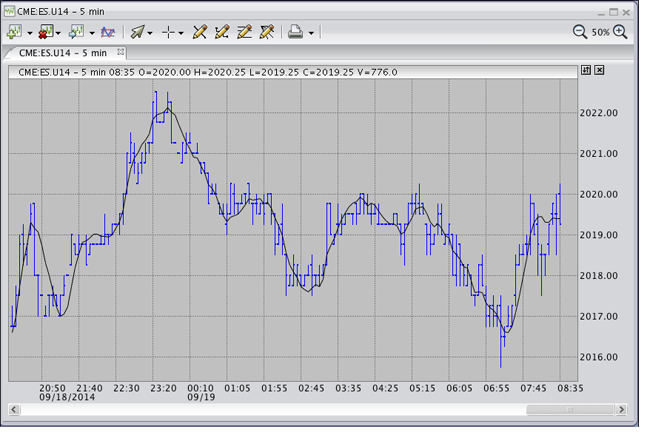
The Indicator is superimposed on the Chart, as shown in the following illustration.
