The formula used in the calculation of Camarilla Pivot Points are:
R4 = C + RANGE * 1.1/2
R3 = C + RANGE * 1.1/4
R2 = C + RANGE * 1.1/6
R1 = C + RANGE * 1.1/12
PP = (HIGH + LOW + CLOSE) / 3
S1 = C - RANGE * 1.1/12
S2 = C - RANGE * 1.1/6
S3 = C - RANGE * 1.1/4
S4 = C - RANGE * 1.1/2
Where R1 through R4 are Resistance levels 1 to 4, PP is the Pivot Point,
S1 through S4 are support levels 1 to 4, RANGE is the High minus the Low
for the given time frame (usually daily). C stands for the Closing price.
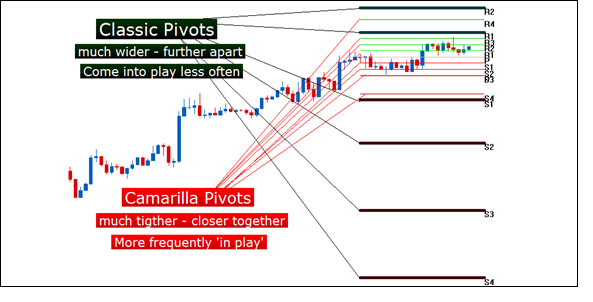
The calculation of Camarilla Pivot Points produces considerably closer levels than other pivot variations might, leading to a more trading activity than other flavors of this popular support and resistance indicator.

Risk Management
A simple mathematical calculation can help traders use the price data from the previous period to find support and resistance levels. The previous period can be defined as an hour, day, week, or month with quite a few variations in between. With Camarilla Pivots, short-term traders will commonly look at the daily variety.
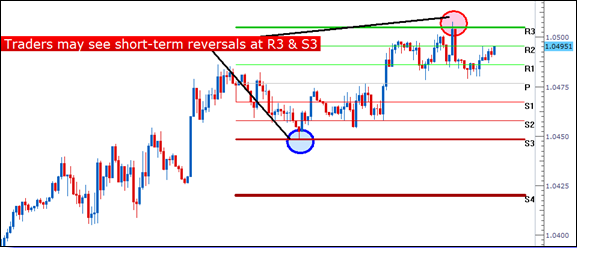
When price approaches the 3rd level of support or resistance, many traders feel the chance of a reversal may be imminent. As such, those traders will often look to take profits at these levels if met while in a winning position. The following illustration will show 2 reversals taking place within the same day on AUDUSD.

Reversals taking place at the S3 & R3 Camarilla Pivot; Created with Marketscope
Alternatively, many traders also feel that if the 4th level of support or resistance is hit the potential for a breakout may be increased. And if this is the case, those traders would want to contain the damage of incorrect trades if these levels get hit on losing positions, looking to place stops just outside of these prices.
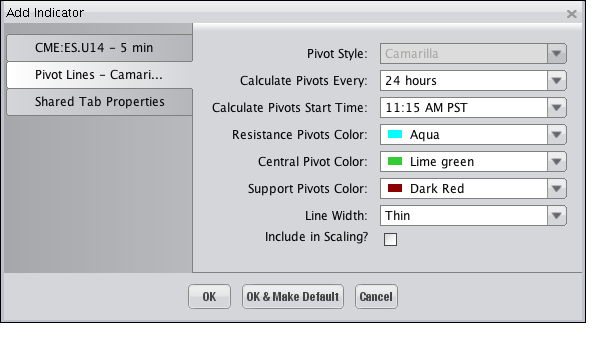
Selecting the Pivot Lines - Camarilla Indicator on the "Indicators and Symbols" list displays the "Add Indicator" dialog, illustrated below, where you an choose among the different options available to have the Indicator display on the Chart as you'd like it to. Click "OK" to add the Indicator.

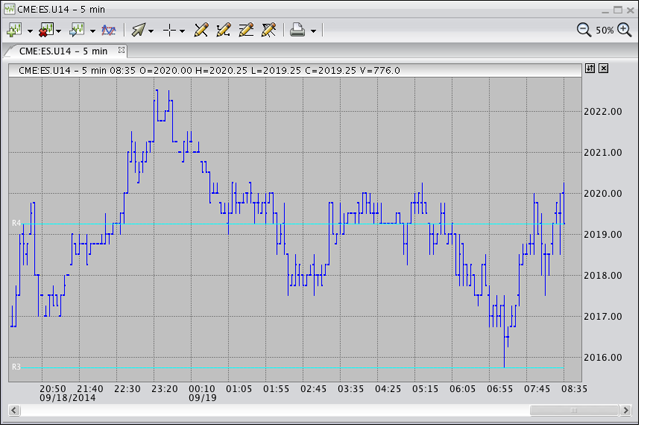
The Indicator is superimposed on the Chart, as shown in the following illustration.
