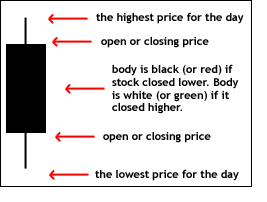
The Candlestick Patterns charting Indicator is a chart that displays the high, low, opening and closing prices for a security for a single day. The wide part of the candlestick is called the "real body" and tells investors whether the closing price was higher or lower than the opening price (black/red if the stock closed lower, white/green if the stock closed higher). The candlestick's shadows show the day's high and lows and how they compare to the open and close. A candlestick's shape varies based on the relationship between the day's high, low, opening and closing prices.

Candlesticks reflect the impact of investors' emotions on security prices and are used by technical analysts to determine when to enter and exit trades. Candlestick charting is based on a technique developed in Japan in the 1700s for tracking the price of rice. There are many short-term trading strategies based upon candlestick patterns, such as the engulfing pattern, harami, harami cross and evening star.
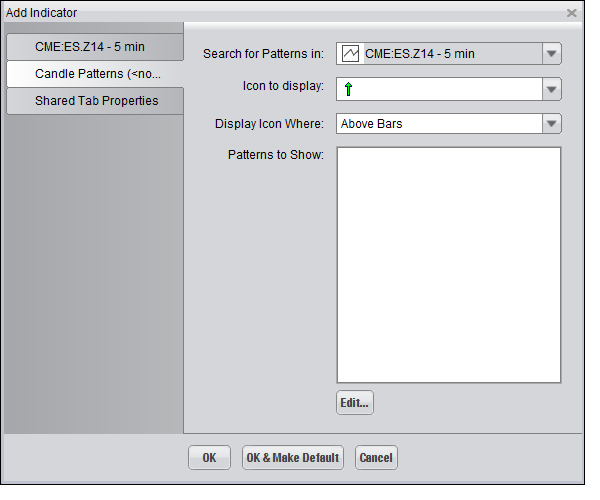
Selecting the Candle Patterns Indicator on the "Indicators and Symbols" list displays the "Add Indicator" dialog, illustrated below, where you an choose among the different options available to have the Indicator display on the Chart as you'd like it to. Click "OK" to add the Indicator.

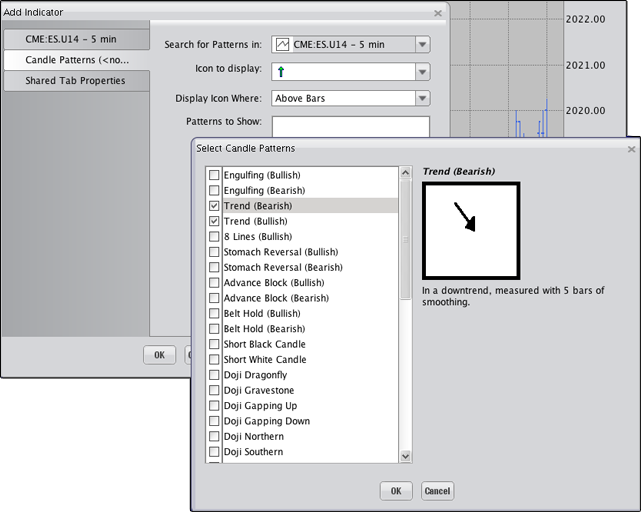
The "Select Candle Patterns" dialog, illustrated below, is displayed. Selecting a checkbox for one of the Candle Patterns shows you what that pattern will look like on the Chart, as well as a definition for what the pattern represents. Click "OK" to add the Indicator.

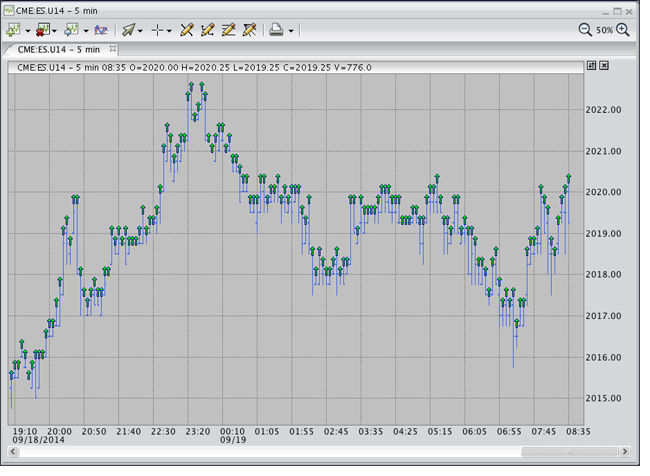
The Indicator is superimposed on the Chart, as shown in the following illustration.
