The Average True Range (ATR) Charting Indicator is measure of volatility
introduced by Welles Wilder in his book: New Concepts in Technical Trading
Systems.
The true range indicator is the greatest of the following:
The Average True Range is a moving average (generally 14-days) of the true ranges.
Wilder originally developed the ATR for commodities but the indicator can also be used for stocks and indexes. Simply put, a stock experiencing a high level of volatility will have a higher ATR, and a low volatility stock will have a lower ATR.
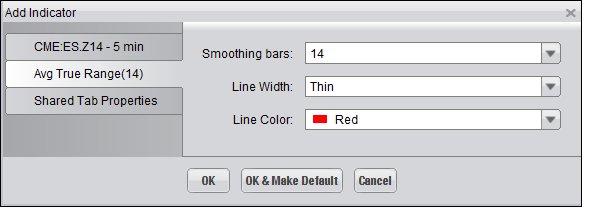
Selecting the Avg True Range Indicator on the "Indicators and Symbols" list displays the "Add Indicator" dialog, illustrated below, where you an choose among the different options available to have the Indicator display on the Chart as you'd like it to. Click "OK" to add the Indicator.

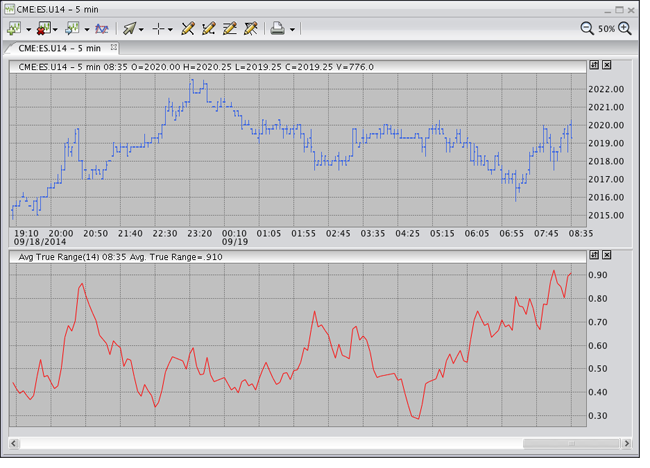
The Indicator is displayed within its own window, as shown in the following illustration.
