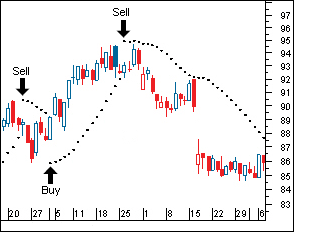
The Parabolic Stop and Reverse (SAR) charting Indicator is a technical analysis strategy that uses a trailing stop and reverse method called "SAR," or stop-and-reversal, to determine good exit and entry points.

This method was developed by J. Wells Wilder. Basically, if the stock is trading below the parabolic SAR (PSAR) you should sell. If the stock price is above the SAR then you should buy (or stay long).
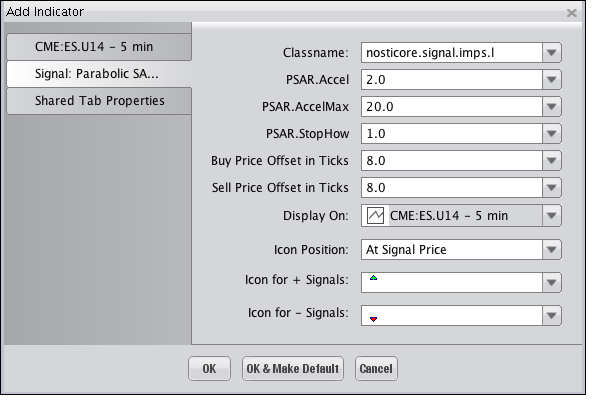
Selecting the Signal: Parabolic SAR Indicator on the "Indicators
and Symbols" list displays the "Add Indicator" dialog,
illustrated below, where you an choose among the different options available
to have the Indicator display on the Chart as you'd like it to. Click
"OK" to add the Indicator.

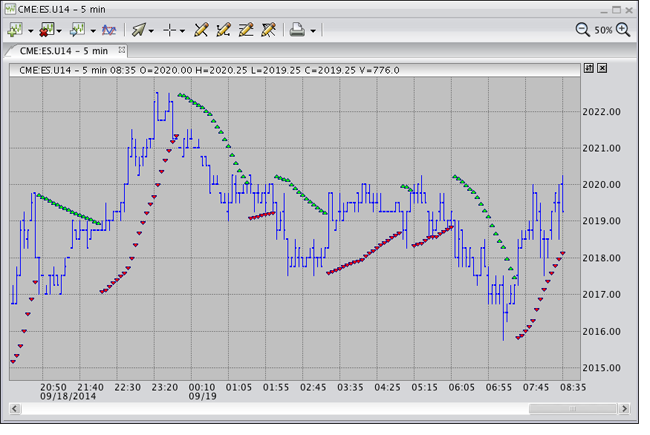
The Indicator is superimposed on the Chart, as shown in the following illustration.
