BOLLINGER BANDS: Bollinger Bands, popularized by analyst John Bollinger, are standard deviation channels. The center line of the Bollinger Band is a moving average. The top and bottom lines are calculated based upon the standard deviation of the moving average. Both inputs are required: The length of the moving average, and the number of standard deviations you wish to display the channels.
Bollinger Bands consist of:
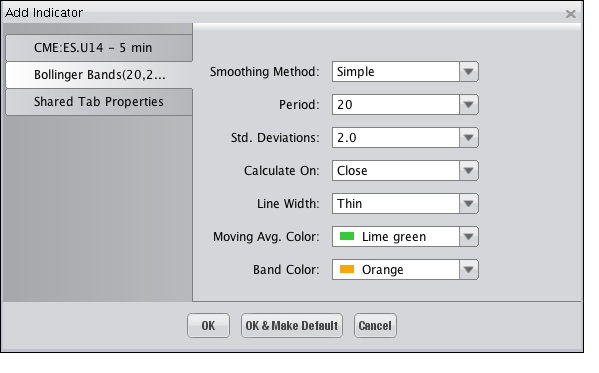
Selecting the Bollinger Bands Indicator on the "Indicators and Symbols" list displays the "Add Indicator" dialog, illustrated below, where you an choose among the different options available to have the Indicator display on the Chart as you'd like it to. Click "OK" to add the Indicator.

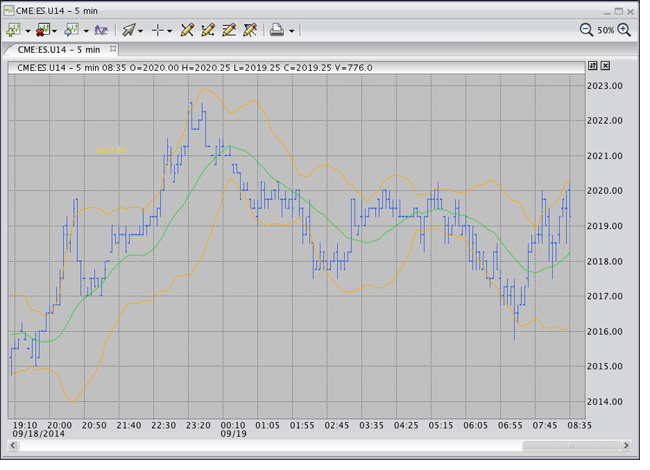
The Indicator is superimposed on the Chart, as shown in the following illustration.

.